It’s the graphic visual representations of data, figures, or knowledge intended to present information quickly and clearly. Infographics design is content strategies that help your brand engage the audiences that matter the most.
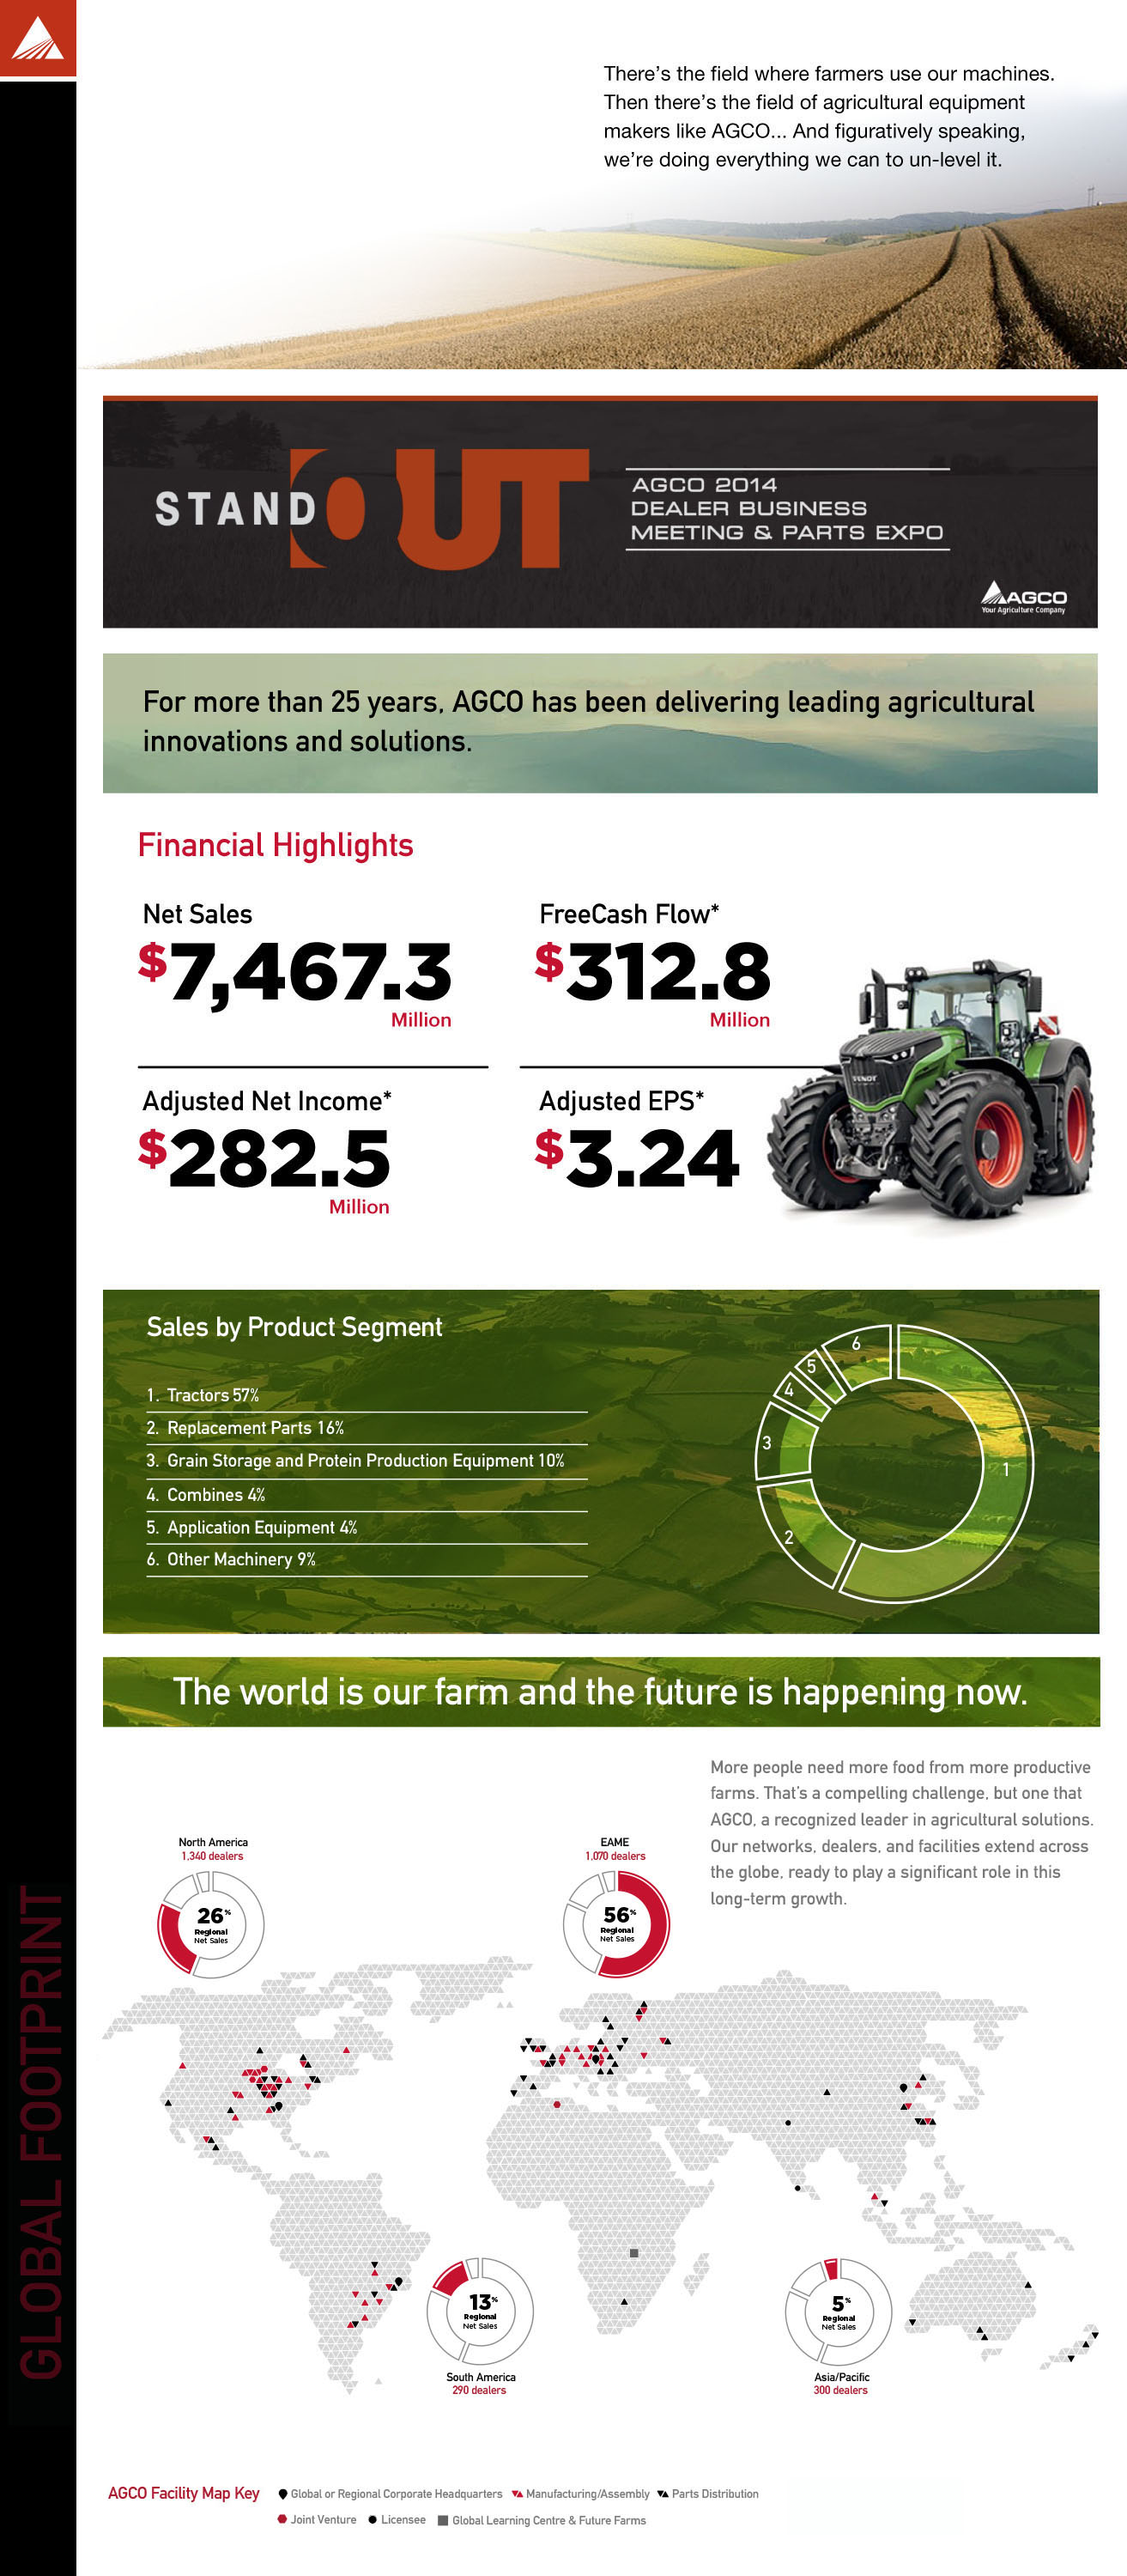
We're approached by a colleague of mine from Dillon Productions regards to an annual report presentation for Agco. Of course, we accepted the project. We needed to create a crowd pleaser show piece for the audience before the main event begin. They didn't have any ideas about what this was going to be yet. This is where we came into play.
SOLUTION
We knew they had a theme for the main event. So, we played with it and the script for the crowd warmer animation loop. We made it playful, funny and entertaining for the audience. Here are the "play on words" animation, and other infographic assets to review while you're here.
OPPORTUNITY
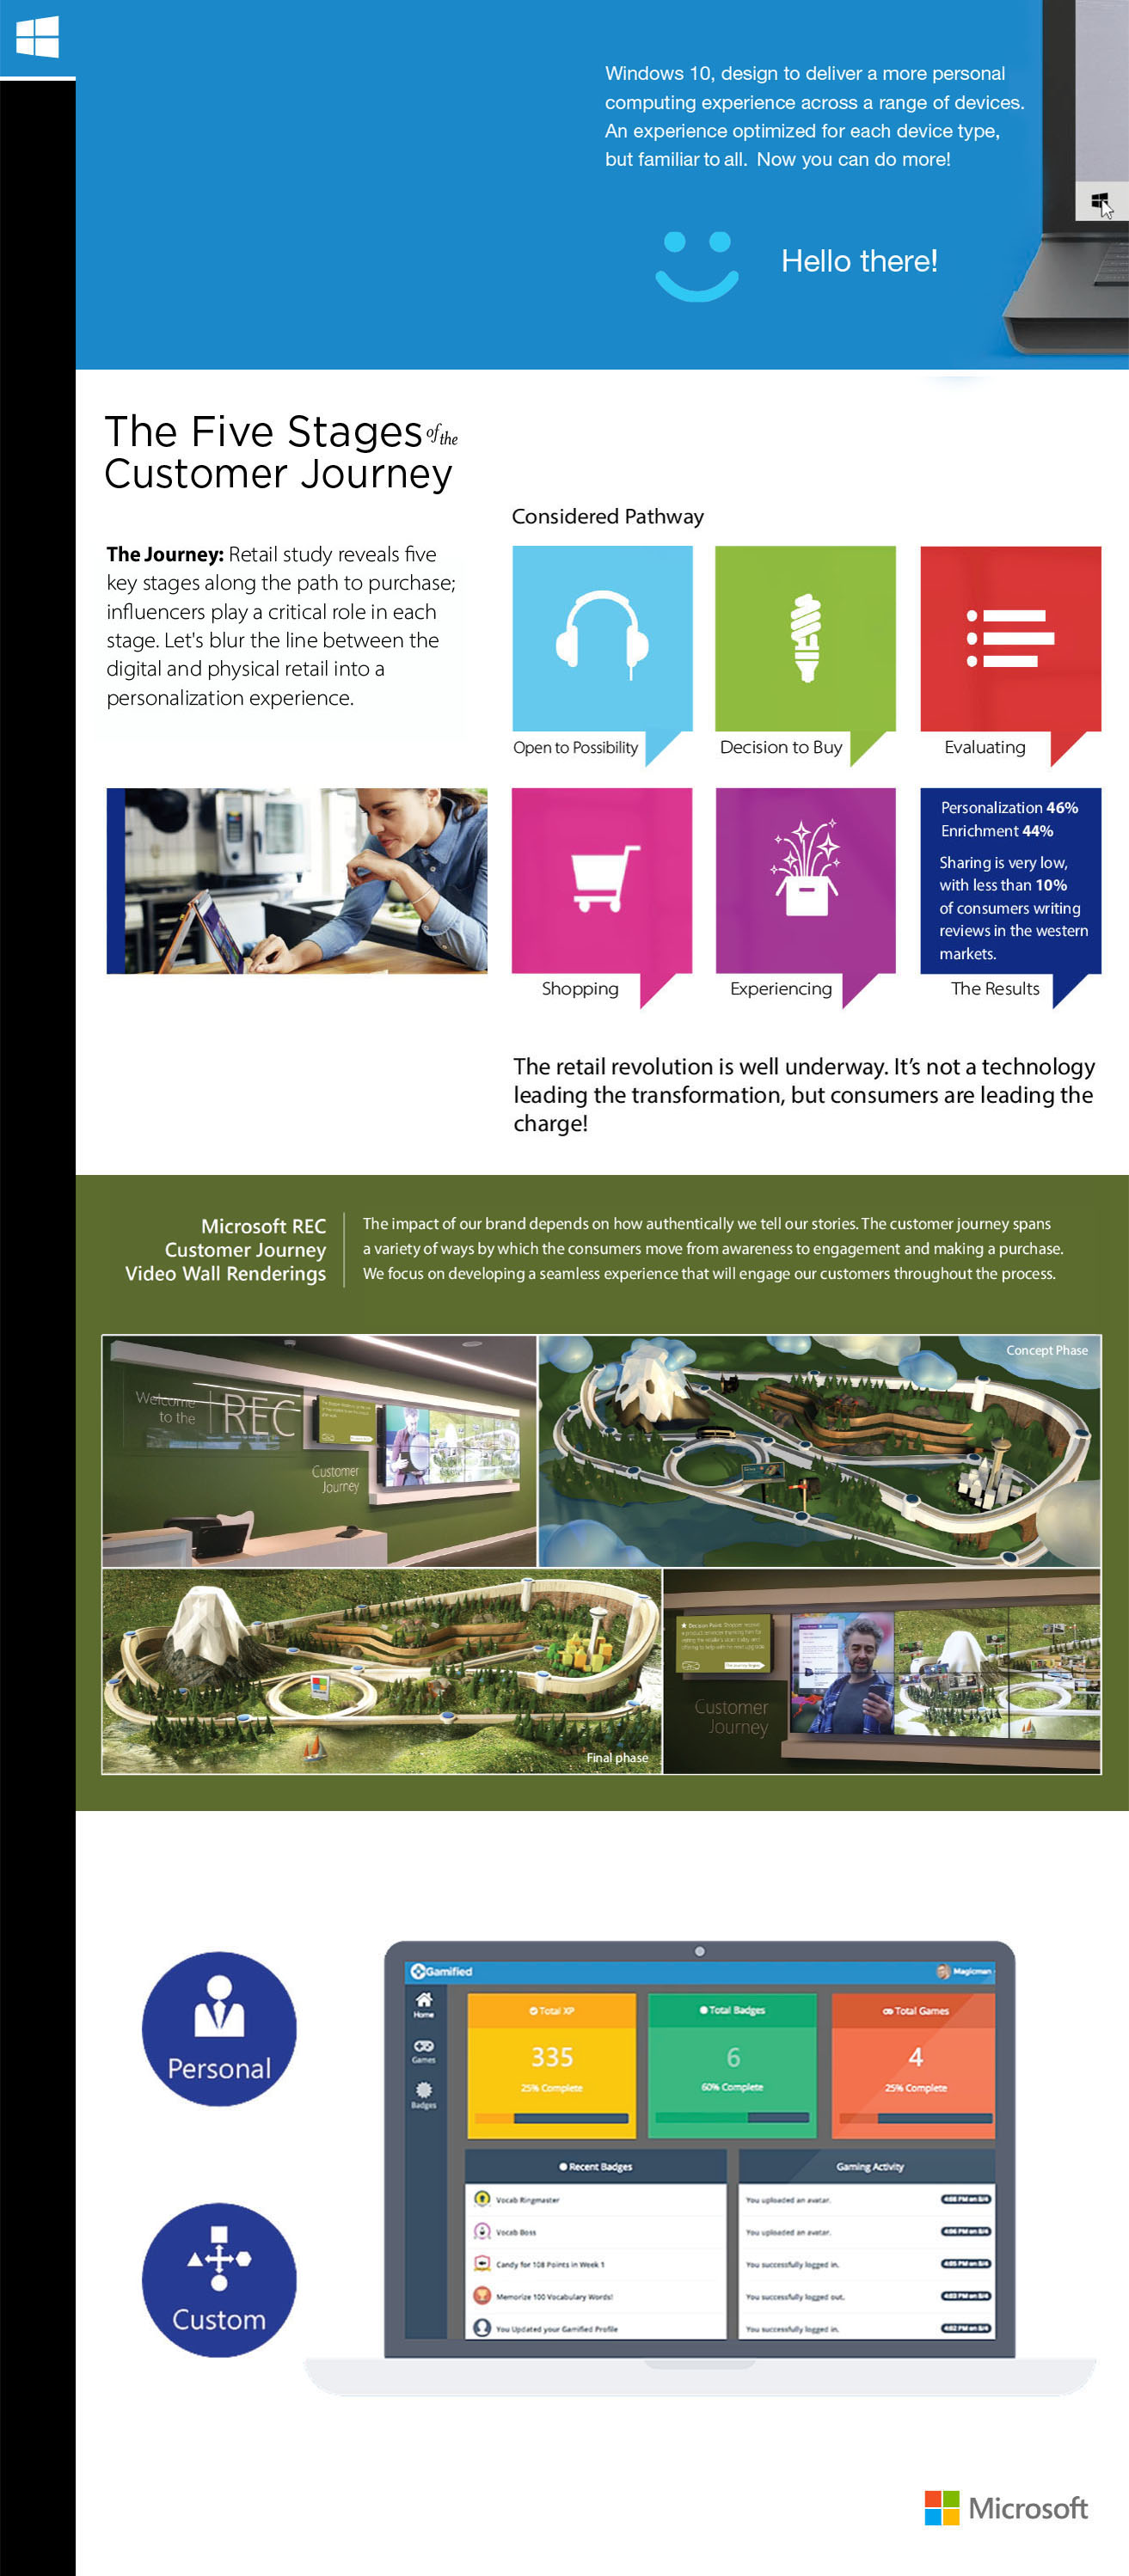
While working at Mircosoft, I had the pleasure to worked on several projects for the retail environmental team. We're approached with a new opportunity to work on a video wall
at the REC. Here are some examples of a few projects.
ROLE
Responsibilities: Recreating and modeling 3D retail environmental designs. Worked on video production, animation, and motion infographics for PPT presentations. Creatives and manage multiple projects throughout the week.
CHALLENGE
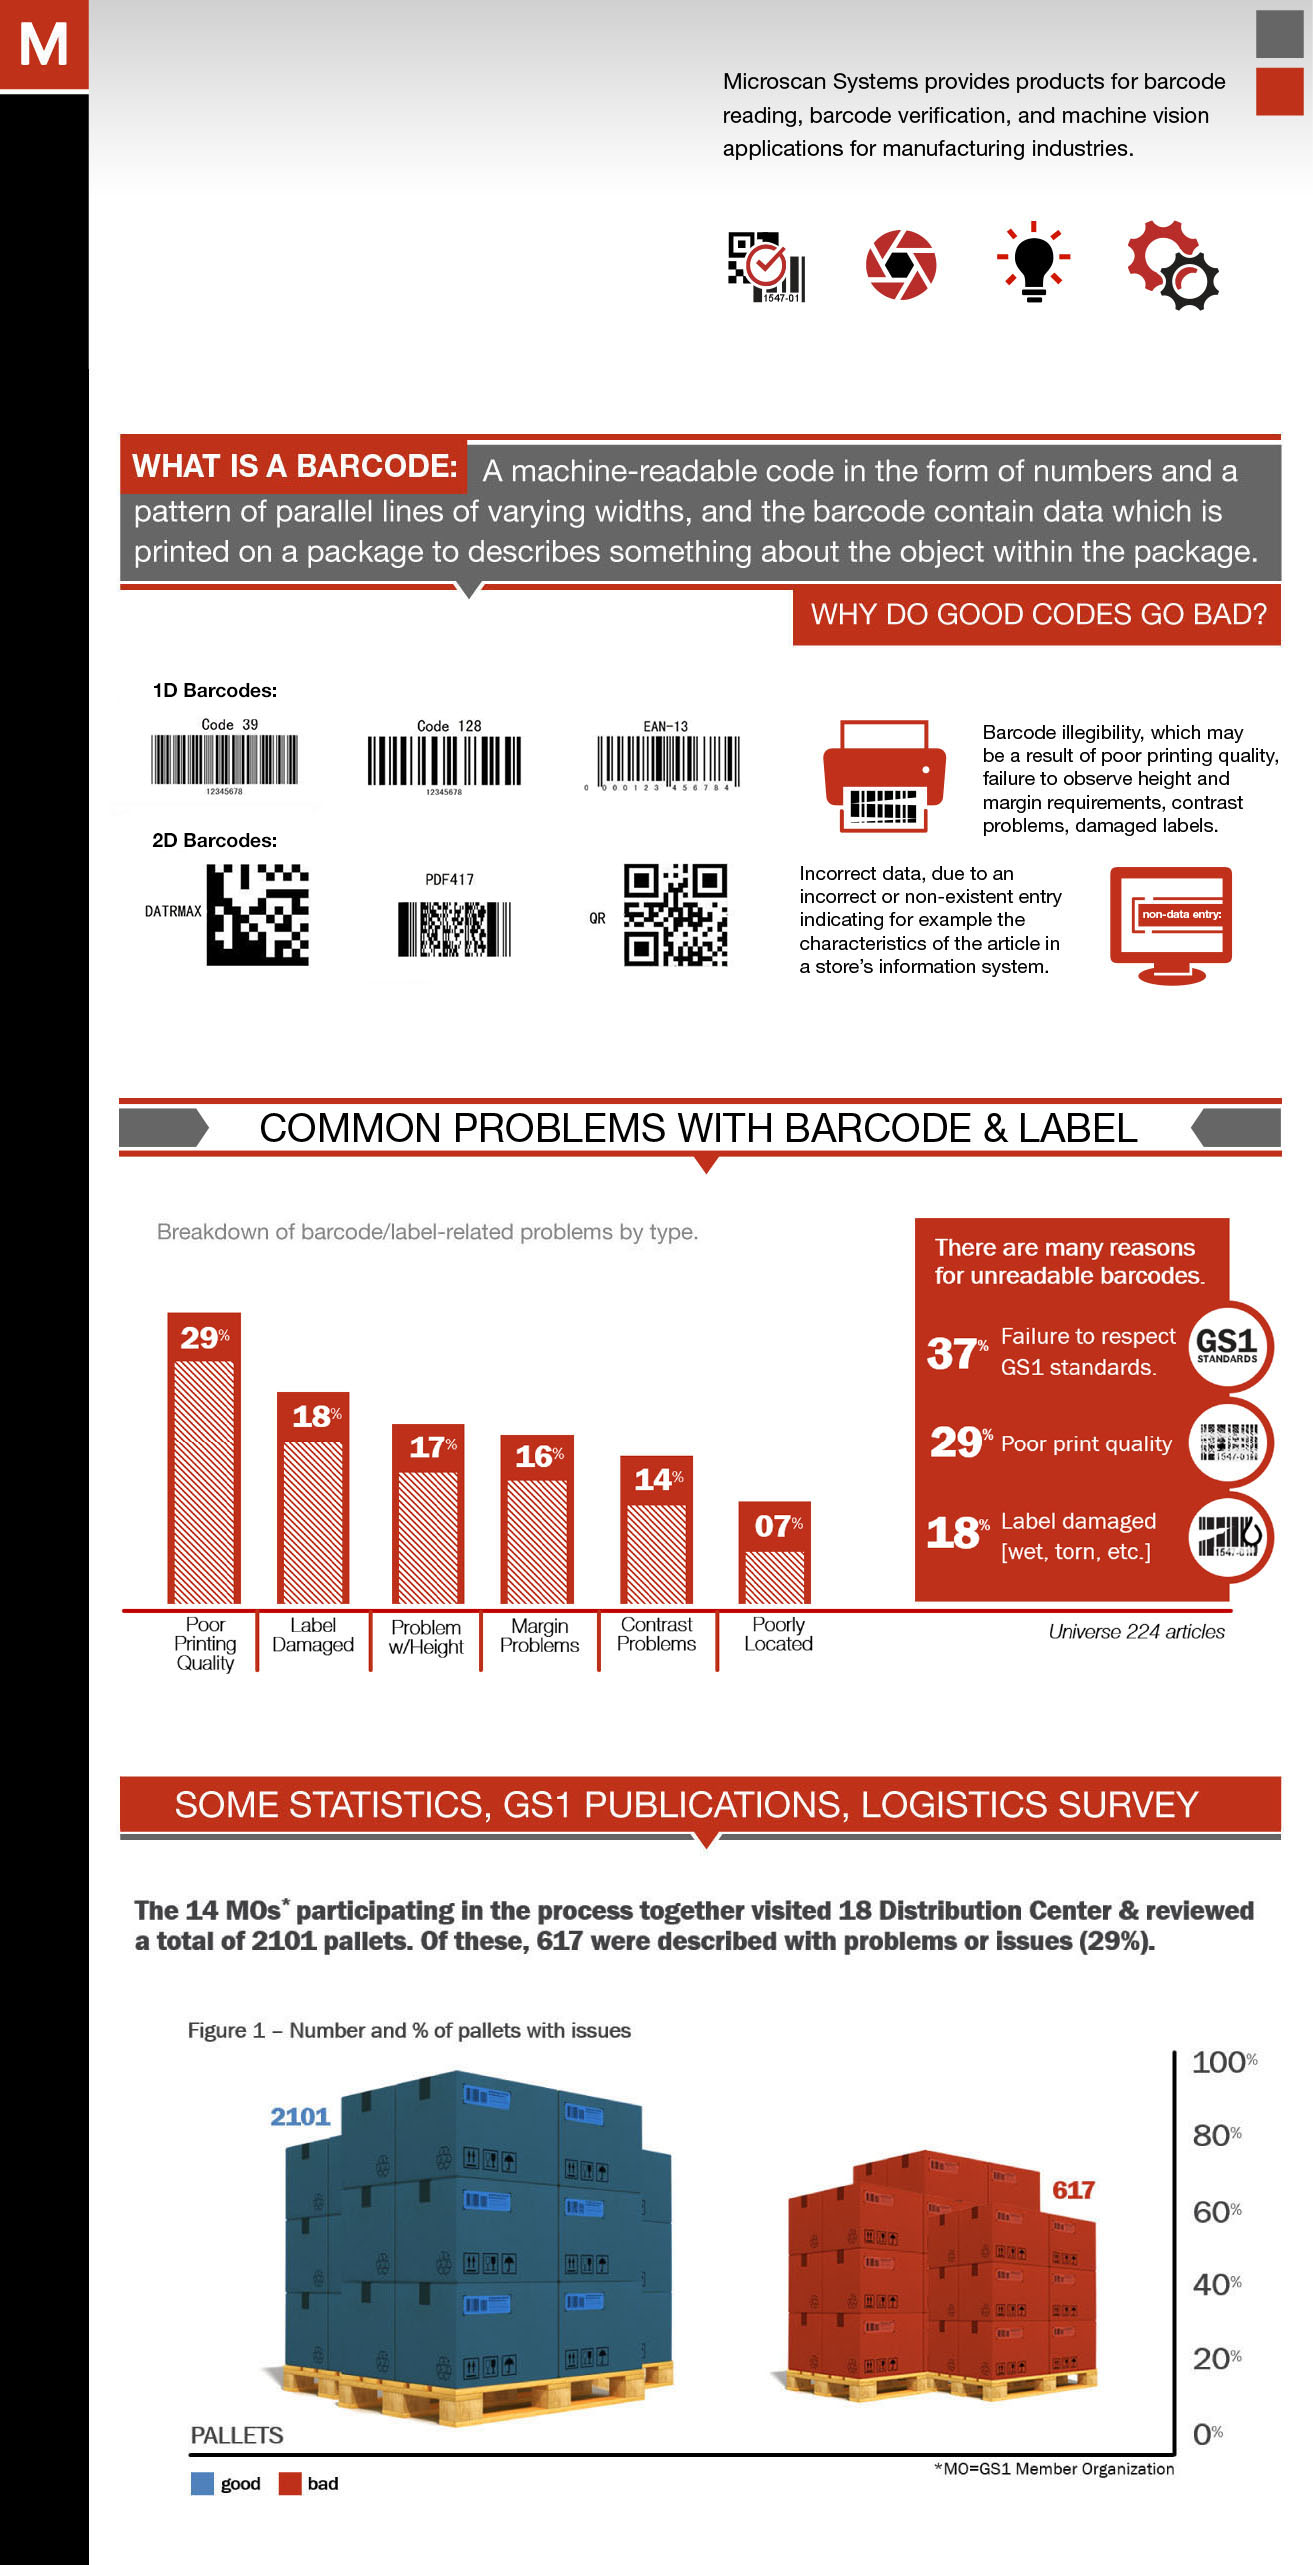
Microscan System was looking to share some ideas about barcode issues and their solutions for these common problems. They approached us to help them highlight these fine points on, "Why Do Good codes Go Bad" presentation.
SOLUTION
This was a straight forward PowerPoint project for their customers. Help them understand Microscan's tools are the clear choice for these common issues in the manufacturing industries. We just needed to jazz it up a bit and delivery. Here are a few infographic elements used in this presentation.
CHALLENGE
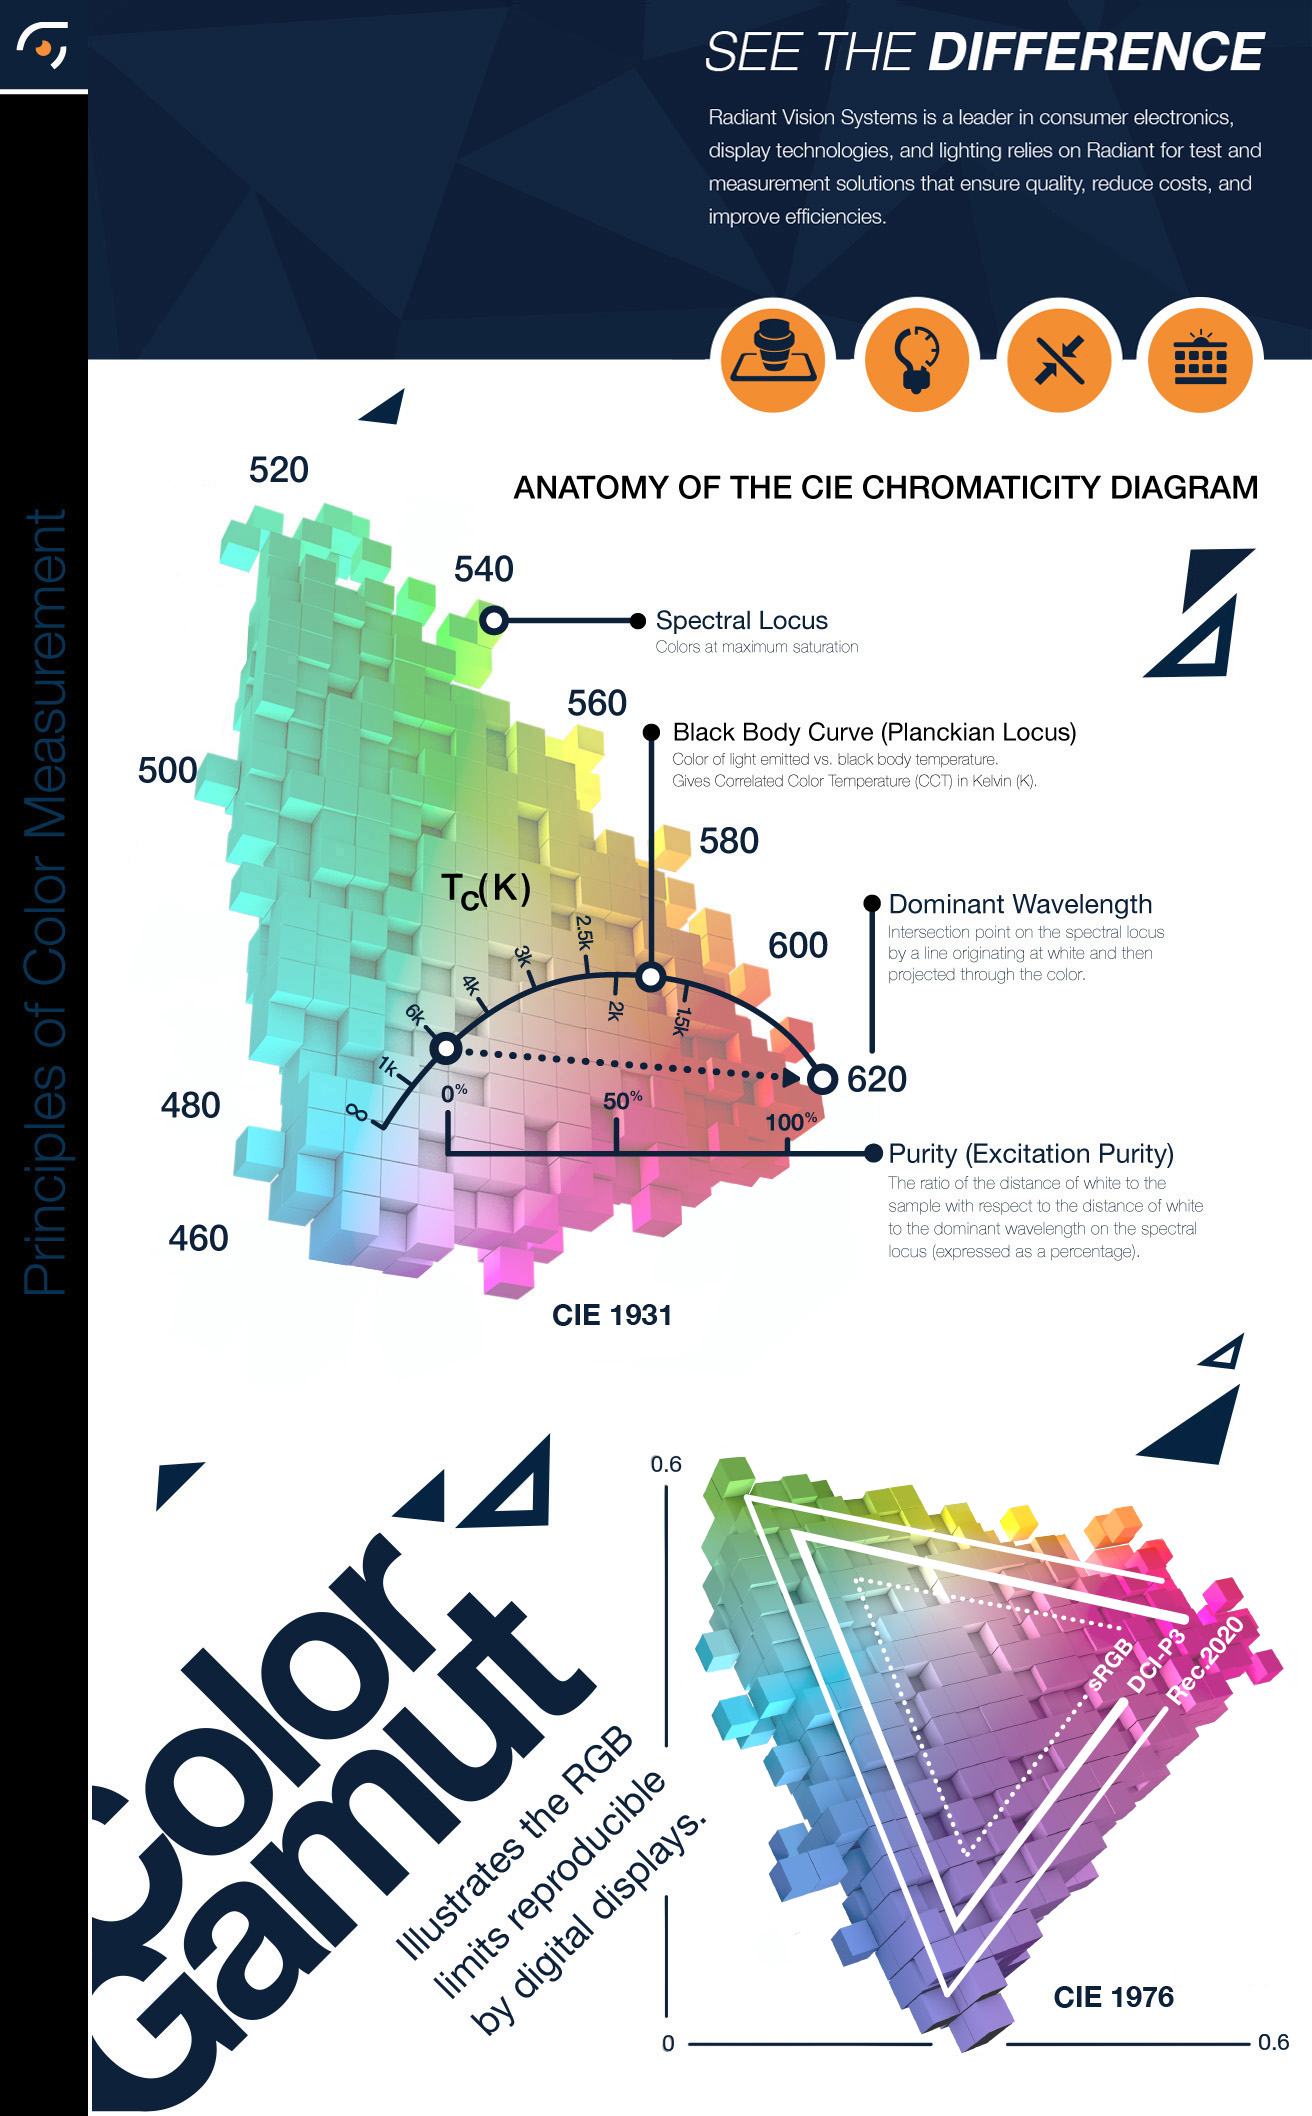
Radiant was looking to share some light on their principles of color measurement poster for their global customers at Display Week 2019. They approached us to help them to bring it to life.
SOLUTION
We wanted to make an infographic that highlighted key areas of this scientific diagram, so we combined Radient’s data with a playful, 3D geometric design style that dive into depth without overwhelming with detail. Here are some of the experimental design elements for the poster.